Over the last months I noticed a couple of cute visualization takes on the Web 2.0 and Enterprise 2.0 space. Now, as I’m putting together the materials for a presentation I am holding next week I thought I’d share some of them …
Here we go, first up there’s this Web 2.0 in a Chart by the Sunlight Foundation, connecting a lot of trends related with web 2.0 (real big pdf, hence there’s no useful thumbnail).
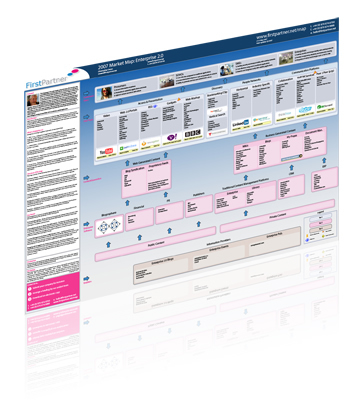
Then, there’s FirstPartner’s take on the Enterprise 2.0 market. I appreciate how it tries to integrate and employ value-chain thinking, but I am skeptical if it’s really useful. Anyway, it’s a cute effort, found via SocialComputing Magazine:
Welcome to the FirstPartner Enterprise 2.0 Market Map. Enterprise 2.0 is a term which many struggle to define and understand. We have therefore developed this market map to articulate the different attributes of this emerging sector.
and
[This shows] the flow from the end-customer through the complete value-chain – covering blogs, wikis, collaboration tools, social networking and bookmarking through to RSS readers and Open APIs/Mashups.

An Enterprise 2.0-sided take on visualization comes by Stephen Danelutti, who proposed an Enterprise 2.0 meme map (building upon the well known O’Reilly web 2.0 meme map).
This I must say is my last favourite, as it mingles and mixes terms and concepts and lacks clear structure (but that is true for the O’Reilly meme map and others as well).
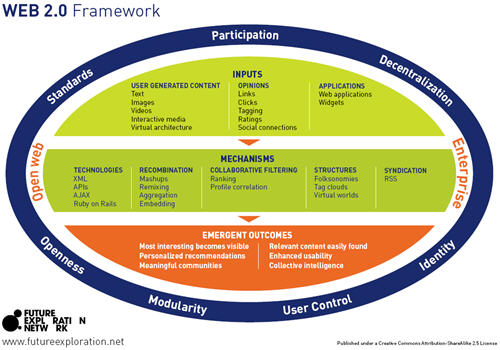
And finally, my favourite, is by Ross Dawson of the Future Exploration Network who proposed a Web 2.0 framework, that nicely captures what Web 2.0 is all about and collects the variety of players in the Web 2.0 ecosystem:

This framework provides a concise view of the nature of Web 2.0. While one can debate whether all important issues are collected, this visual approach lends itself to kicking off discussions (where one can elaborate further on). It provides a nice starting and reference point, and this is essential: When advising on the ideas and concepts of Enterprise 2.0 in the corporate world, I’m experiencing that it’s best to explain both instruments (methods and tools, i.e. the “how”) and goals and visions (paradigms and principles, the “why”) intertwined …